 |
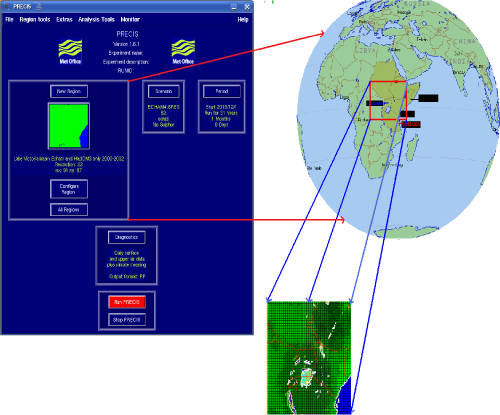
| Figure 2: The PRECIS model user interface; The left diagram shows an interactive window where PRECIS is run by selecting a region from the global map, a scenario and GCM to downscale from a given set and also period to run the model. The middle diagram shows how the selected region appears on the screen with the grids. The right diagram shows the boundary of the Model that was selected for the study. |