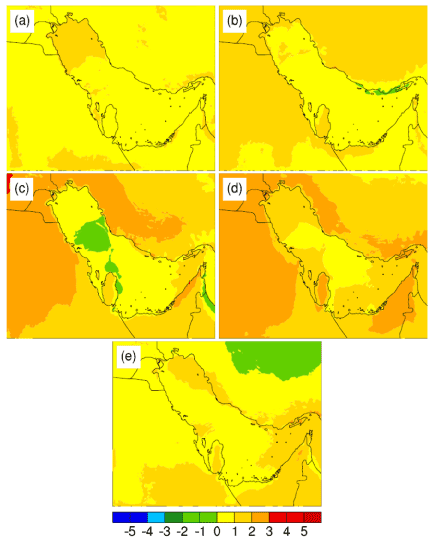
Figure 9
WRF-RCM (D03) 4 km by 4 km grid resolution. Maps showing differences in monthly average Maximum temperature between present (2006- 2010) and Future (2056-2060). (a) May, (b) June, (c) July, (d) August, (e) September.