 |
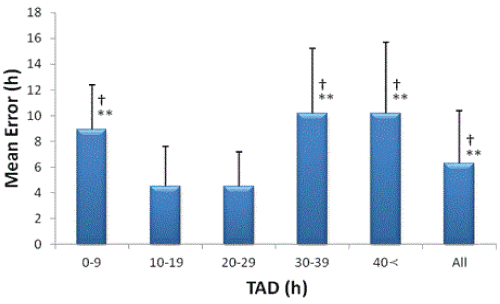
| Figure 6: Comparison of the mean error in the estimation of TAD, compared to the actual TAD in each of the 10-h TAD intervals, using corneal color analysis in photographs taken in room light. † P <0.01, compared to 10-19 h, ** P<0.01, compared to 20-29 h, TAD: Time after Death. |