 |
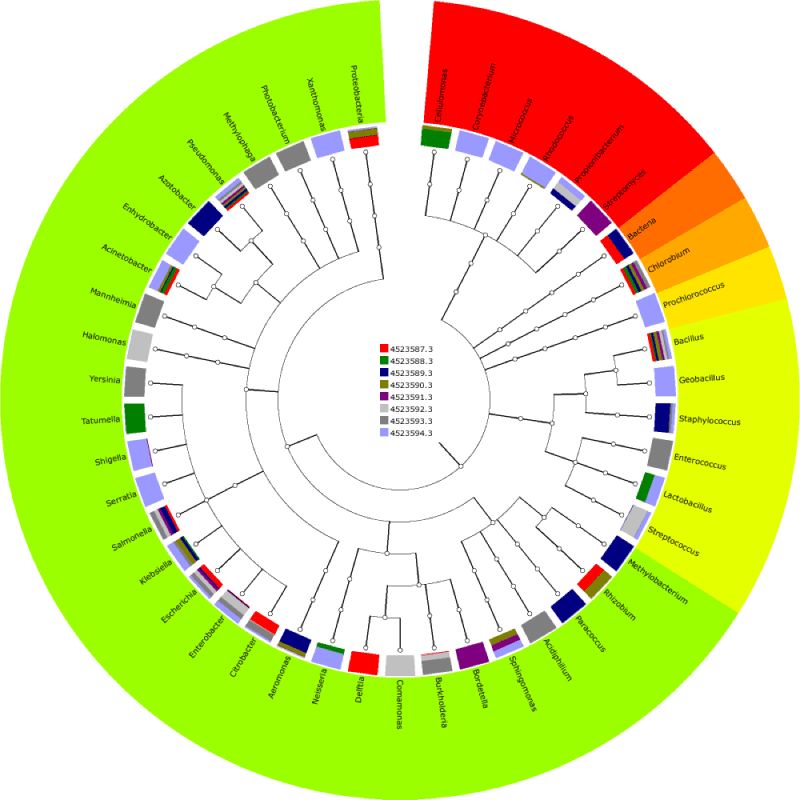
| Figure 3:Phylogenetic tree of the bacterial genera detected in the DNA dataset according to M5NR annotations. Figure 3 shows the phylogenetic tree of the bacterial genera detected in the metagenomic study according to M5NR annotations. Genera that belong to the same phylum were colored with the same color. This data was calculated for DNA dataset (4523587.3 (DNA1), 4523588.3 (DNA2), 4523589.3(DNA3), 4523590.3 (DNA4), 4523591.3 (DNA5), 4523592.3 (DNA6), 4523593.3 (DNA7) and 4523594.3 (DNA8)). The data was compared to M5NR using a maximum e-value of 1e-5, a minimum identity of 60%, and a minimum alignment length of 15. Maximum level was chosen to be genus, colored by phylum and the view was restricted to bacteria domain. It is noted from the figure that Proteobacteria is the dominant phylum followed by Firmicutes and Actinobacteria. |