 |
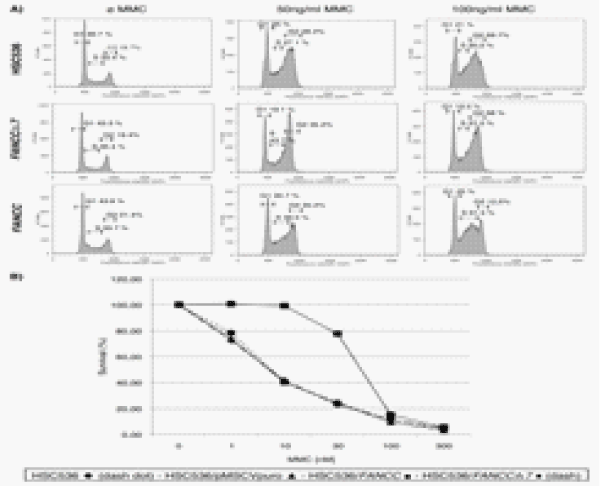
| Figure 4: Cell cycle profiles and survival assay. (A) FACs analysis of the FANCC- deficient cell line HSC536 infected with FANCC cDNA, FANCCΔ7 cDNA or not infected at all. Cells were treated with indicated concentrations of MMC for 24 hours prior to FACs analysis. (B) MMC-induced cell death. Differential survival of HSC536 (lozenge, dashed and dots), HSC536/ pMSCVpuro (triangle, full line), HSC536/FANCC (square, full line), HSC536/ FANCCΔ7 (circle, dashed line) cells after 5 days of incubation in escalating concentrations of MMC. The fraction of surviving cells was measured by the AlamarBlue assay. |