 |
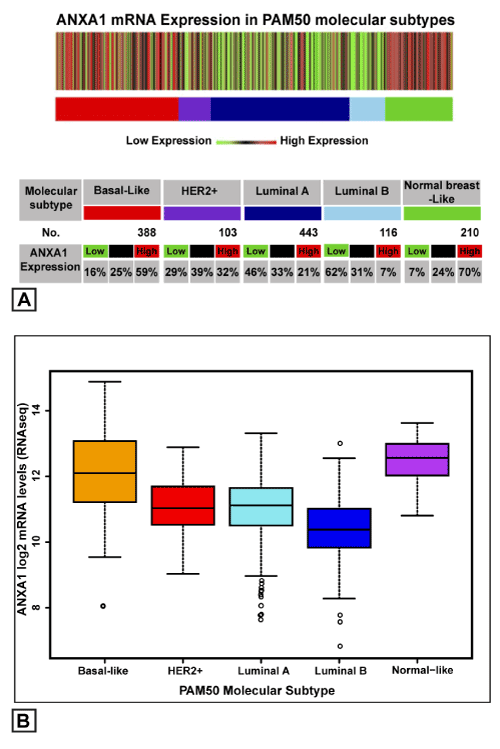
| Figure 1: ANXA1 mRNA expression in PAM50 molecular subtypes of breast cancer using bc-GenExMiner database v3.0. A. The figure and table show the patients with low, intermediate and high ANXA1 expression in each molecular subtype. The basal-like and normal-like subtypes contain more patients with high expression of ANXA1. In contrast, luminal A and B subtypes comprise more patients with low expression of ANXA1. B. TCGA mRNA sequencing dataset including 844 patients showing that ANXA1 is highly expressed in basal-like subtype. *** p-value < 0.001, Tukey’s test. |