|
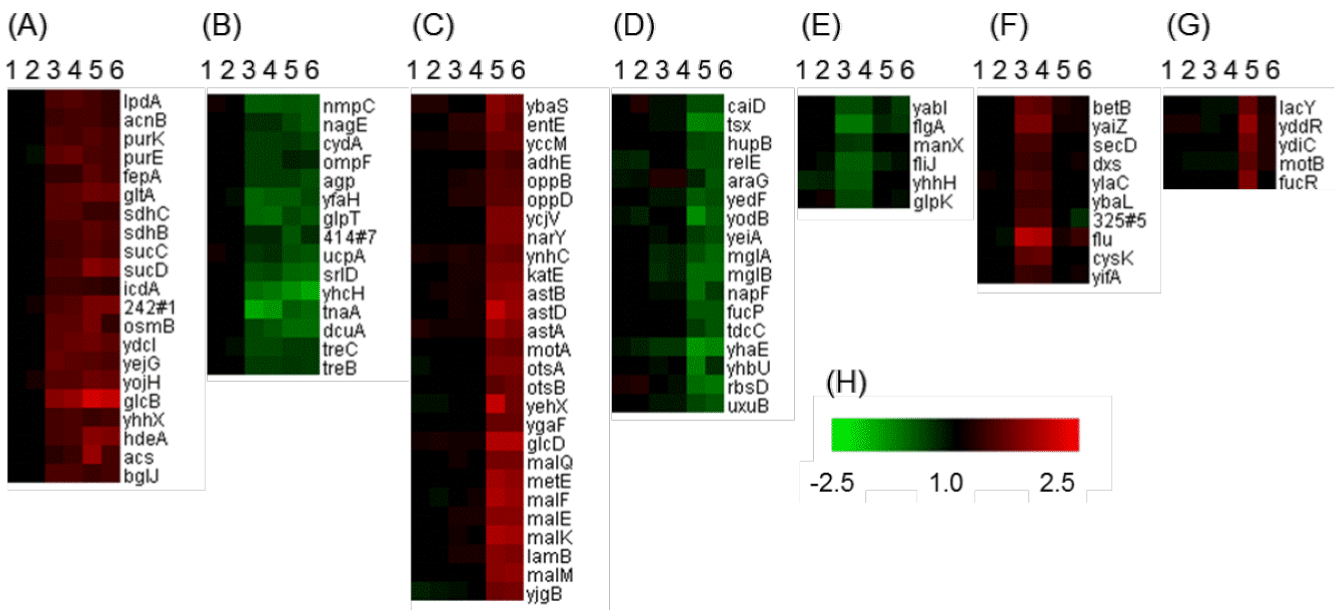
| Figure 3: K-means clustering analysis of DNA-array data.Original data from GenoBase (14). Two spots of the same gene were compared on a slide: 1 and 2, wild-type spots; 3 and 4, wild-type and ΔarcA strains; 5 and 6, wild-type and ΔarcB strains. Red denotes messenger RNA (mRNA) increase in gene-deletion strain. Green denotes mRNA decrease in gene-deletion strain. (A) Genes with increased expression levels in both ΔarcA and ΔarcB strains. (B) Genes with decreased expression levels in both ΔarcA and ΔarcB strains. (C) Genes with increased expression levels in ΔarcB strain. (D) Genes with decreased expression levels in ΔarcB strain. (E) Genes with decreased expression levels in ΔarcA strain. (F) Genes with increased expression levels in ΔarcA strain. (G) Genes with increased expression levels in ΔarcB strain at only one spot. (H) Color bar indicating expression level. |