 |
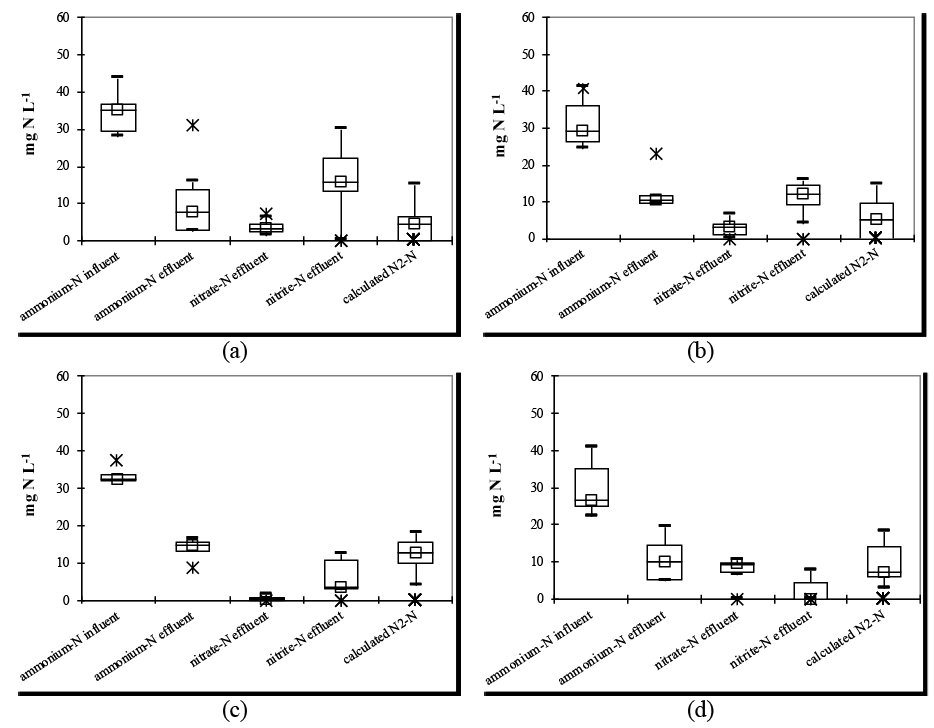
| Figure 2: Concentration of nitrogen compounds in each monitored condition: (a) 1 (day 181to 220); (b) 2 (day 221 to 246); (c) 3 (day 247 to 259); (d) 4 (day 260 to 270). Data include inter-quartile deviation and median (larger box), (□) average value, (ж) outlier and (─) maximum (upper whisker) and minimum (lower whisker) limits of non-discrepant values. |