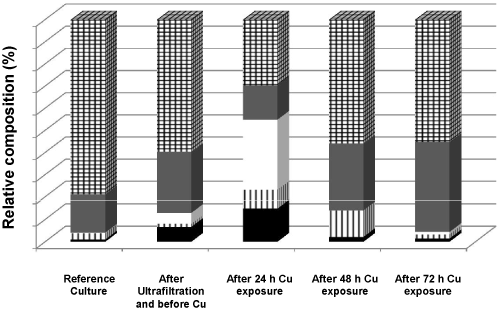
Reference culture, after ultrafiltration and before biochemical manipulation, after 24 h biochemical manipulation, after 48 h biochemical manipulation hydrocarbons, stripe=free sterol, white=triacylglycerol, gray=acetone mobile polar lipids, grid=phospholipids.