 |
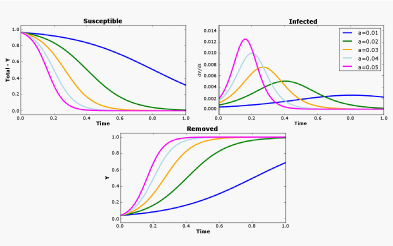
| Figure 1: SIR Analysis of a Hypothetical Epidemic Approximated by Y and dY/dt. (top left ) Susceptible (S) approximated by Total – Y – dY/dt, (top right) Infected (I) approximated by dY/dt and (bottom) Removed (R) approximated by Y – dY/dt. The non-linear parameter a was varied from 0.01 to 0.05. |