 |
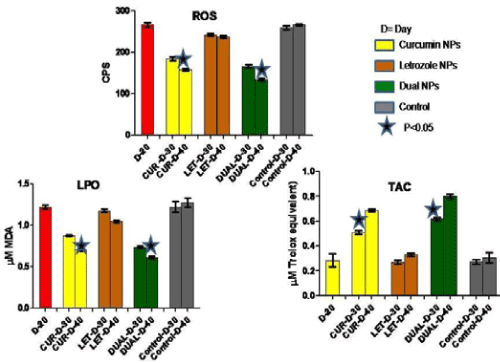
| Figure 12: Serum oxidative stress markers including ROS, LPO, and TAC levels in mice with endometriosis before and after treatment with NPs. The red bar depicts mice with endometriosis on D20. The effect of various NPs in different groups on various days is shown. |