 |
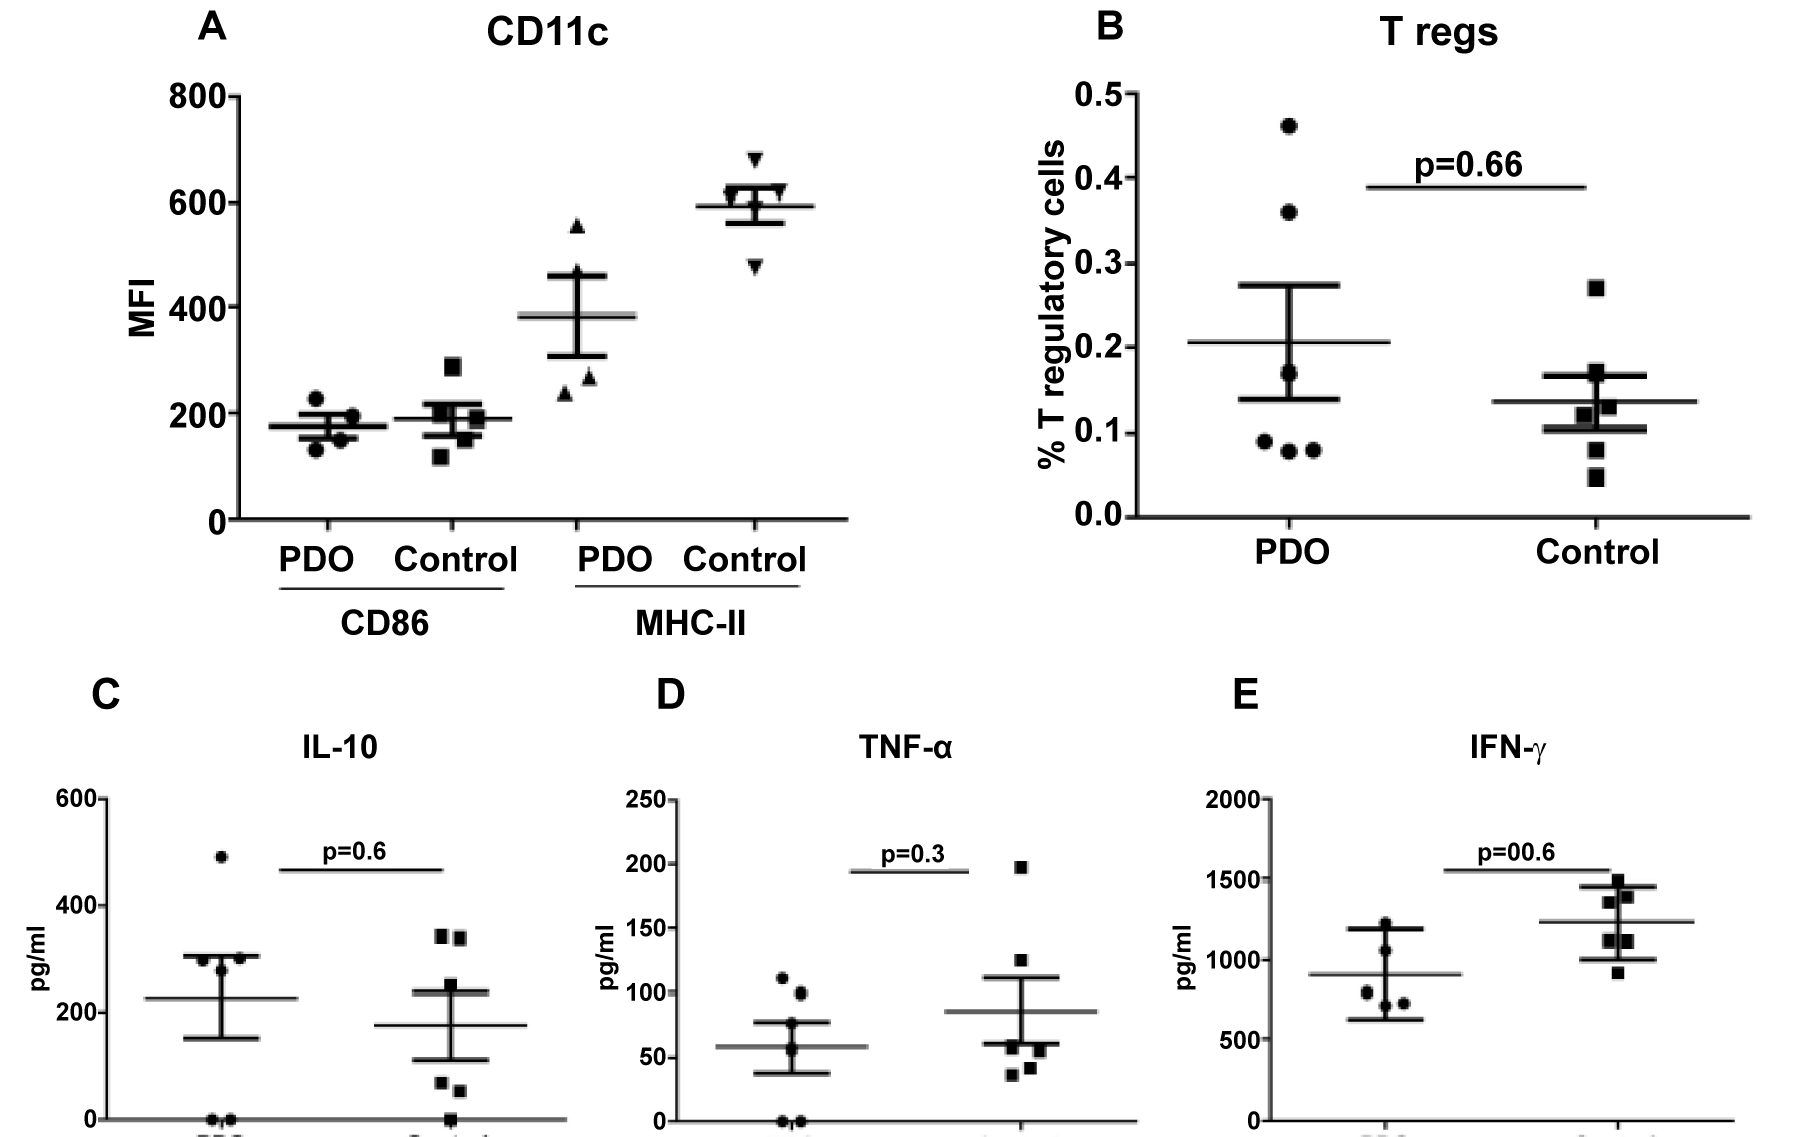
| Figure 3: In vivo effects of PDO after injection in mice. The effect of PDO on DC activation, T reg generation and cytokine secretion was measured in inguinal lymph node cells using flow cytometry and ELISA. A. Dot Plot depicts the MFI of expression of activation markers, CD86 and MHC-II on CD11c gated DCs. B. The percentage of CD4+, CD25+, FoxP3+ T reg cells were measured by flow cytometry and are depicted in the dot plot. C, D & E. Secretion of cytokines, IL-10, TNF-α and IFN-γ was determined by ELISA. Data is mean +/- S.E. of 6 mice. Each dot corresponds to one mouse. |