 |
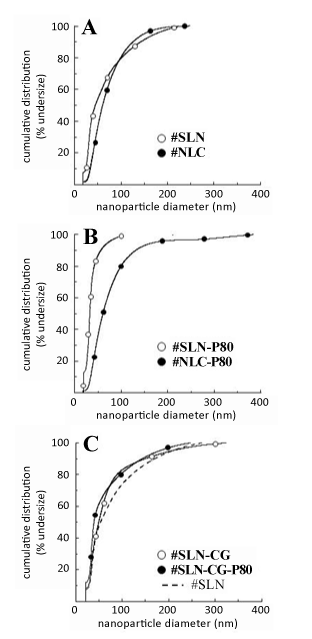
| Figure 2: Effect of lipid nanoparticle constituents, presence of fluorescent dye and production parameters on particle dimensions, as determined by sedimentation field flow fractionation analysis. Graphs show the cumulative size distribution analysis (by number) of solid lipid nanoparticles (open circles) and nanostructured lipid carriers (closed circles) (A), lipid nanoparticles treated by polysorbate 80 (B) or lipid nanoparticles treated by polysorbate 80 containing the fluorescent dye cardiogreen (C). For nanoparticle identification codes, composition and preparation procedure, please refer to Table 1 and experimental section. |