(A) Pure TiO2 NPs (VWR, 32 nm), (B) beef kidney IRM, and (C) calf liver IRM, recoveries calculated using target values showed in Table 2
*mean ± standard deviations (n=3)
 |
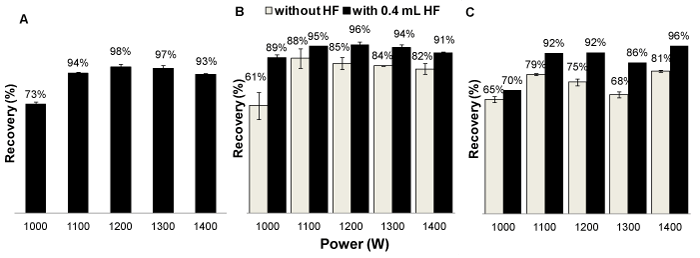
| Figure 2: Optimisation of the power (W) applied for the digestion programme. (A) Pure TiO2 NPs (VWR, 32 nm), (B) beef kidney IRM, and (C) calf liver IRM, recoveries calculated using target values showed in Table 2 *mean ± standard deviations (n=3) |