 |
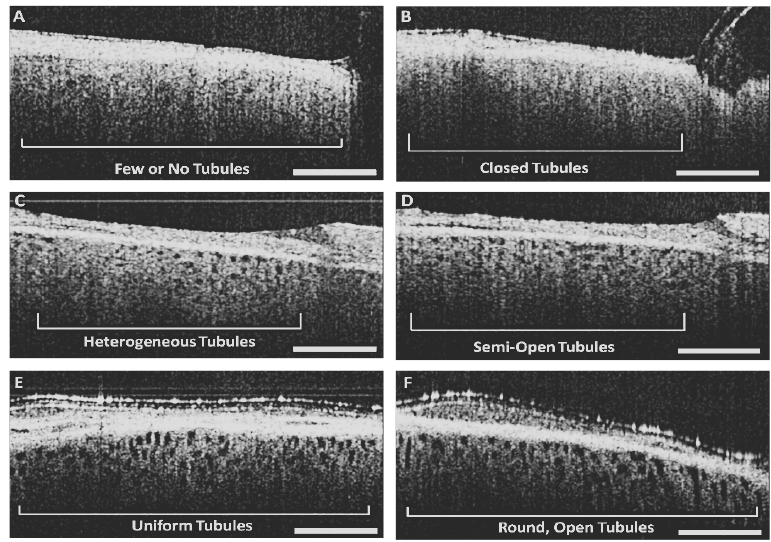
| Figure 5: Examples of variation of in vivo OCT images of human kidneys for tubule size/shape and density/uniformity. Tubule size/shape: (B) poor (D) moderate (F) good. Tubule density/uniformity: (A) poor (C) moderate (E) good. Scale bar=500 μm. (Reprinted with permission from JIOHS, 7 (4), 130064, 2014). |