|
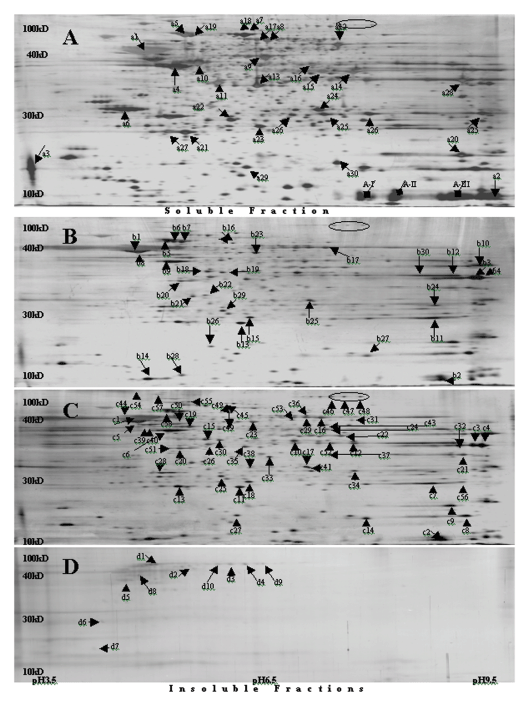
| Figure 1: Representative 2-DE maps of sequential protein extraction fractionsc from rat spinal cords. Top 30 most highly abundant proteins spots are arbitrarily marked with arrows by the order of spot staining intensity (scanned volume) in each gel. Figure 1A, soluble fraction; Figures B and C, insoluble fractions with differentenhanced extraction systems. Spots A-I, II, III (marked with solid squares) in Figure 1A are contaminated hemoglobins and excluded in our analysis. In Figure 1C, another 30 enriched spots (two are overlapped with the top 30 most highly abundant proteins) are marked, which are highly expressed in the insoluble fractions. Elliptical areas show representative insoluble-protein-enrichment effect in enhanced fractions B and C. Gel size: 245 x 180 x 1 mm3 (13% T, 3% C). Silver staining. |