 |
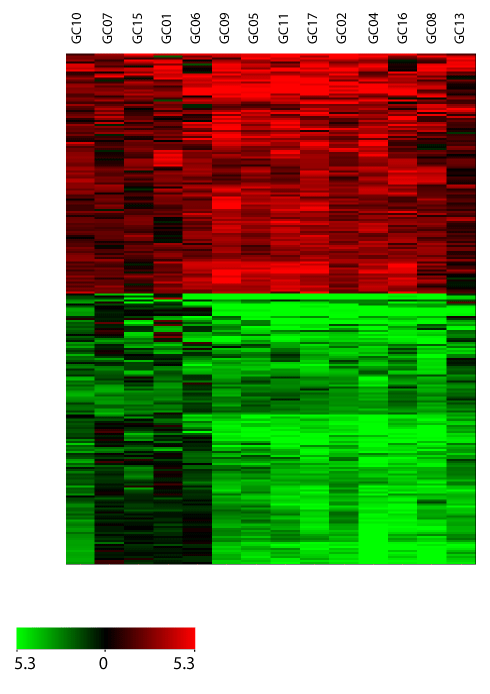
| Figure 1: Heat map of differentially expressed genes in gastric cancer. Unsupervised hierarchical clustering was performed on gene expression profiles of fourteen cases of gastric adenocarcinoma tumors and their adjacent normal. The heat map of differentially expressed genes based on clustering is shown in the figure. Each column represents a specimen and each row represents a gene. Red color indicates genes that were upregulated and green color indicates genes that were downregulated. Black indicates genes whose expression is unchanged in tumors as compared to normal. |