|
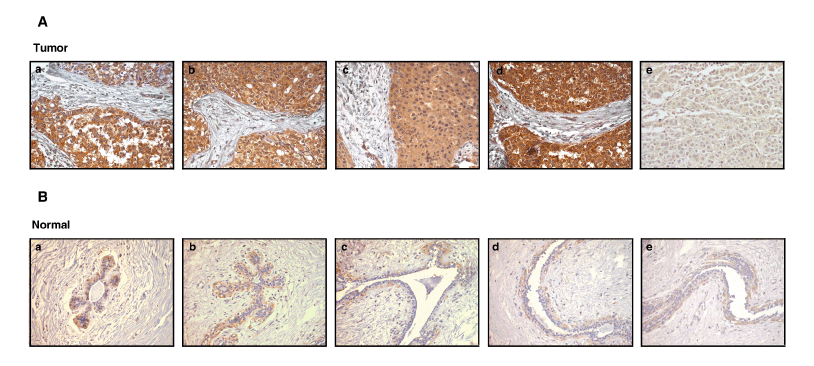
| Figure 2: The pattern of expression of KIFAP3 protein breast cancers and normal breast tissue sections. Tissue sections from TMAs stained with anti-KIFAP3 antibody. (A) This panel of five tissue sections represents breast cancer cases. Tumor sections a-d show significant overexpression of the KIFAP3 protein. Tumor section e represents a case that does not show KIFAP3 overexpression (B) This panel represents five normal breast tissue sections showing a weak expression of KIFAP3. All images were acquired at 200X magnification. |