 |
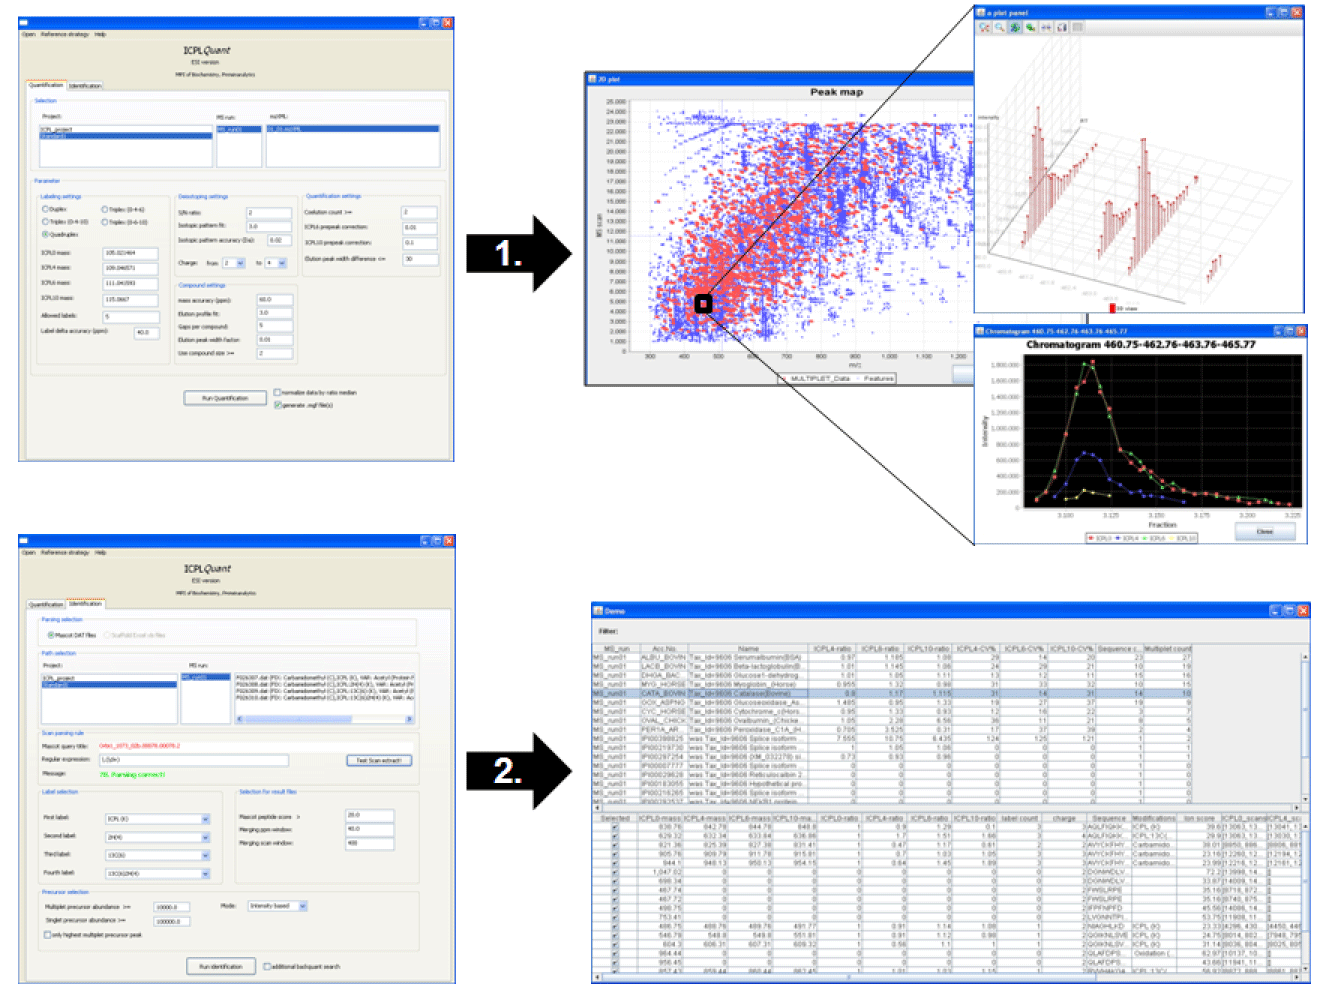
| Figure 2: Graphical user interfaces of ICPL_ESIQuant. (1) shows the quantification interface and the graphical tools for investigating the peak map and the quantified ICPL multiplets; (2) shows the identification interface and the protein result table that is accessible with MS Excel. |