 |
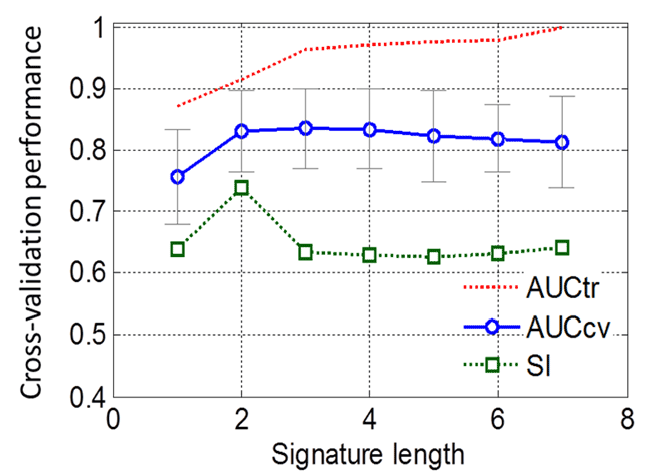
| Figure 10: Cross-validation of low and high urinary Nickel samples each having 18 observations. The diagram shows cross-validated and combined training AUC values for various signature set sizes ranging from 1 to 7. The combined AUC values were obtained by multivariate logistic regression. The algorithm is an unbiased, 100 times repeated, 10-fold cross-validation test. As shown, the optimal result is obtained for three glycans in the signature, resulting in cross-validated AUC = 0.836, while the training (observed) AUC value is 0.966. The diagram also shows the Kuncheva stability index (SI), which reaches the maximum at two glycans. The reason SI drops after two glycans is the fact that the third and fourth glycans (GID = 133 and 136, see figure 11) alternate in various cross-validation folds. |