 |
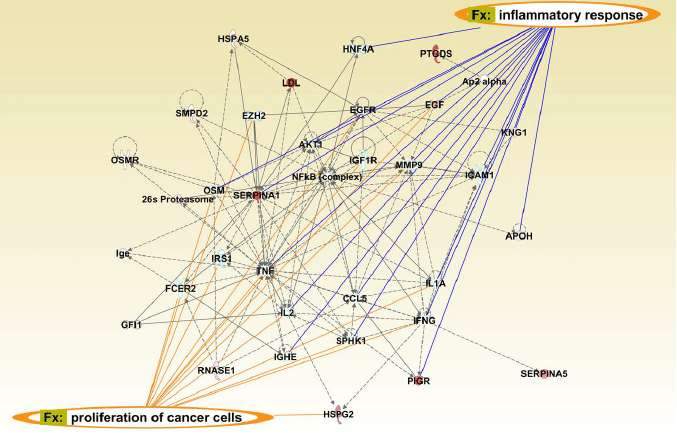
| Figure 7: Schematic representation of derived pathways associated with liver cancer and inflammation. The networks of these identified proteins mapping to the canonical pathways from Ingenuity Pathways Analysis (IPA, Ingenuity Systems) library were employed for the analysis of proteins with increased or decreased expression. Identified proteins shown in red color were displayed with different shapes to indicate different functions. The biological interrelationships between molecules were represented as arrows. All drawn arrows were cited and supported by at least one reference from the literature, textbooks, or canonical information stored in the Ingenuity Knowledge Base. Fx denoted for function. |