|
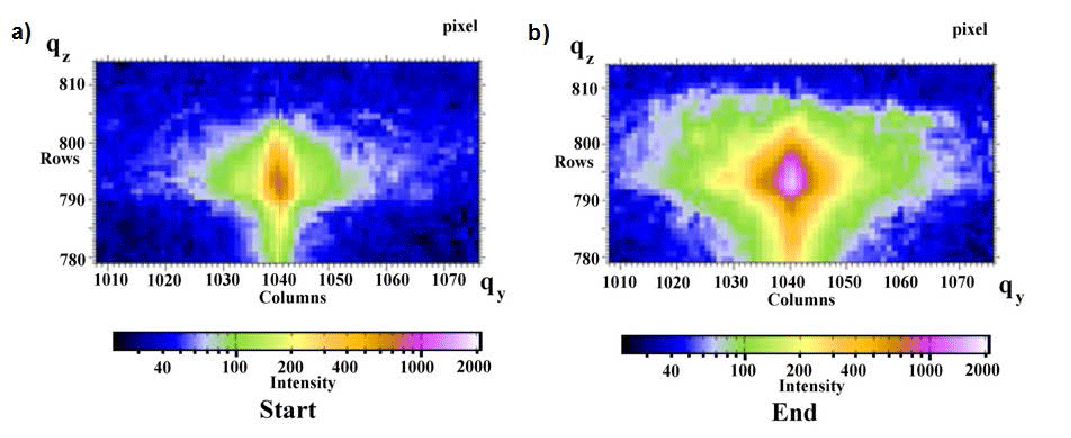
| Figure 2: Real Yoneda peak region within the real GISAXS pattern of growing Thaumatin crystals in the presence of LB nanotemplate at the beginning (left) and the end (right) of data acquisition. Qz increases from the top to the bottom of the graphs toward a decreasing row numbers of pixels on the detector, and Qy, given as columns, increases to the left and right from the center of the pattern (slightly modified from [35,36]). |