 |
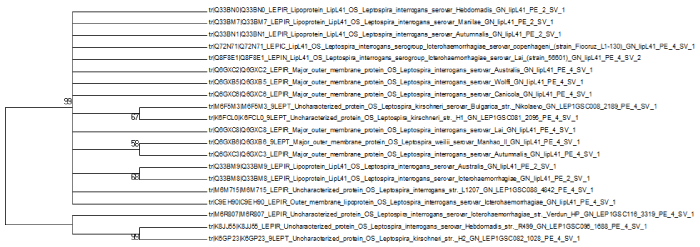
| Figure 2: A phylogram of 20 selected sequences of LipL41. The bootstrap values calculate the frequency for each taxon bipartition during replication and boot strapping denotes measures how consistently the data support given taxon bipartitions. The scale bar also represents branch length (number of amino acid substitutions/100 residues). The high bootstrap value 99 shows the uniform support and bootstrap values close to 100% which indicate that the clade is a group which means that all the characters in a group believed to comprise all the evolutionary descendants of a common ancestor which is rooted with different serovars and strains as the ancestral group. |