 |
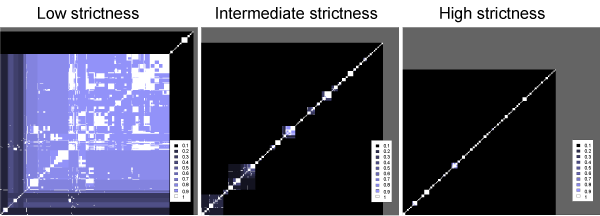
| Figure 2: Three example joined cluster plots (all proteins against all proteins) for 4N results with different parameter settings. The color indicates for each pair of proteins at which threshold they are joined in the same cluster. Grey represents proteins that are not assigned to any cluster. In results of 4N with low strictness, almost every protein is assigned to clusters. When 4N is set stricter, fewer proteins are assigned to clusters and the clusters are smaller. Note that the three plots are not ordered in the same way as each joined cluster plot is calculated and sorted individually. |