 |
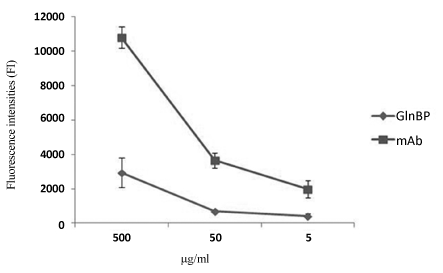
| Figure 11: Fluorescence intensity analysis (FI) of the subarrays (shown in Figure 9) spotted with untreated gliadin at decreasing concentrations (500, 50 and 5 μg/ml) and incubated with the 4F3 monoclonal antibody and recombinant GlnBP both labeled with Alexa Fluor 555. Error bars indicate the standard deviations around the mean values obtained from the analysis of the spots in triplicate. |