 |
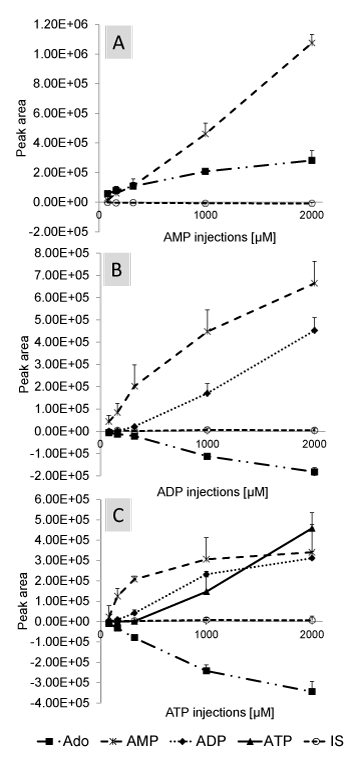
| Figure 5: Dependency between calculated peak areas of Ado (■), AMP (), ADP (♦) and ATP () and the injection of AMP, ADP or ATP in different concentrations (80 μM, 160 μM, 320 μm, 1 mM and 2 mM); internal standard (IS) peak areas are presented as well (O). Standard deviations shown are calculated out of n=4. |