 |
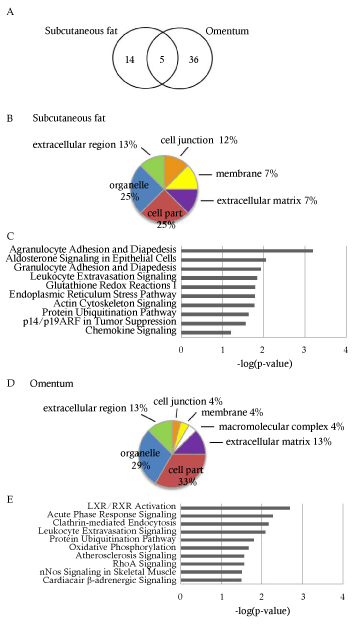
| Figure 2: Comprehensive proteome of proteins that are differentially expressed in diabetic vs non-diabetic patients in subcutaneous fat and omentum. (A) Venn diagram depicting the number of proteins differentially expressed in diabetic vs nondiabetic patients in subcutaneous fat and omentum. (B,D) Subcellular compartment distribution in subcutaneous fat and omentum, respectively. (C,E) Top canonical pathways in subcutaneous fat and omentum, respectively. |