 |
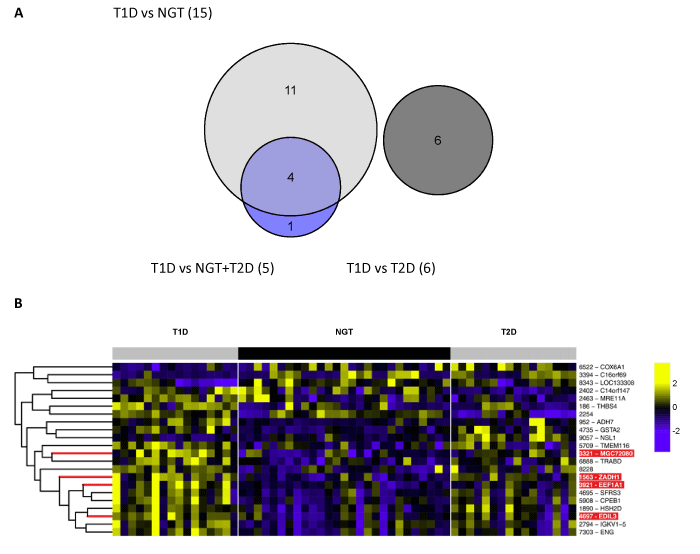
| Figure 2: ROTS detections. (A) Numbers and overlaps of the ROTS detections (FDR < 0.05) in the three comparisons: T1D vs NGT, T1D vs NGT+T2D, and T1D vs T2D. (B) A heat map representation of all these 22 proteins detected by ROTS. The columns show the total of 59 samples from three groups (T1D, NGT, T2D) and the rows correspond to the 22 detected proteins. The 4 proteins overlapped between T1D vs NGT and T1D vs NGT+T2D are highlighted in red: EEF1A1 (eukaryotic translation elongation factor 1 alpha 1), EDIL3 (EGF-like repeats and discoidin I-like domains 3), ZADH1 (PTGR2, prostaglandin reductase 2), and MGC72080 (MGC72080 pseudoprotein). The ZADH1 and MGC72080 were not found in original study [29]. The signal intensities were log2-transformed and autoscaled similarly as in the original study [29]. Yellow represents increase and blue means decrease in abundance. |