 |
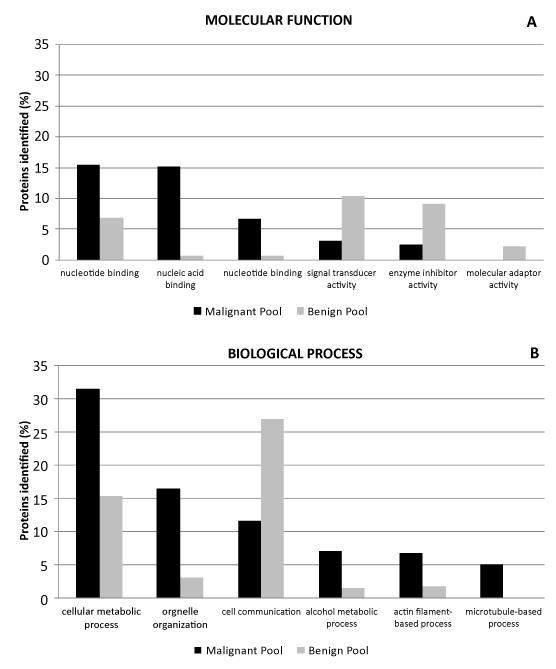
| Figure 2: Ontology analysis. Ontology analysis of the proteins identified in the malignant pool (n=550) and in the benign pool (n=320) according to (A) molecular function and (B) biological process. Level 3. P< 0.005. Only the most abundant protein annotations are show in figure (>2%) and not all proteins identified were annotated with specific molecular function and associated with biological processes in the GO database. |