 |
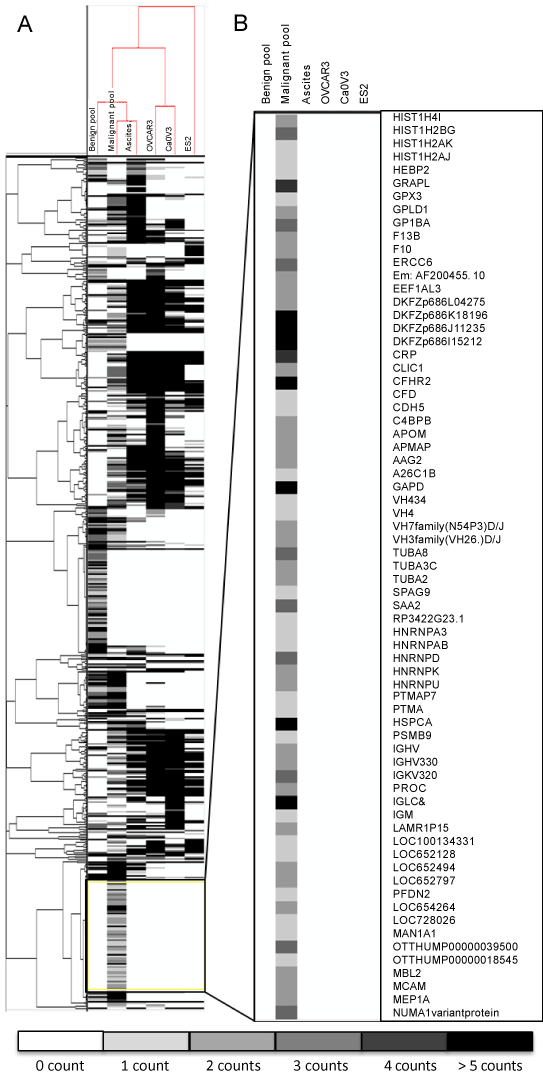
| Figure 3: Cluster analysis. A: Cluster analysis of 593 genes detected in the benign pool and malignant pool in a comparative analysis with OVCAR3, CaOV3, ES2 and ovarian cancer cells from ascites, using spectral count data. Correlation coefficients (R): Malignant x Ascites (0.79); Malignant/Ascites x Benign (0.67); OVCAR3 x CaOV3 (0.70); Benign/Malignant/Ascites x OVCAR3/CaOV3 (0.34); Benign/Malignant/Ascites/OVCAR3/CaOV3 x ES2 (0.07). B: 69 genes detected only in the malignant pool. |