|
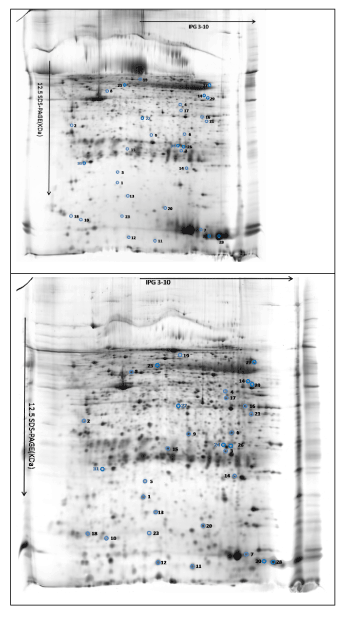
| Figure 1: Proteomic analysis of lungs from SCNT and control pigs. Representative 2-DE image of the controls(above) and SCNT-derived lungs (below).The proteins were visualized by silver staining and significantly different (p<0.05) between the control and SCNT-derived lungs (see Table 1 for details). |