 |
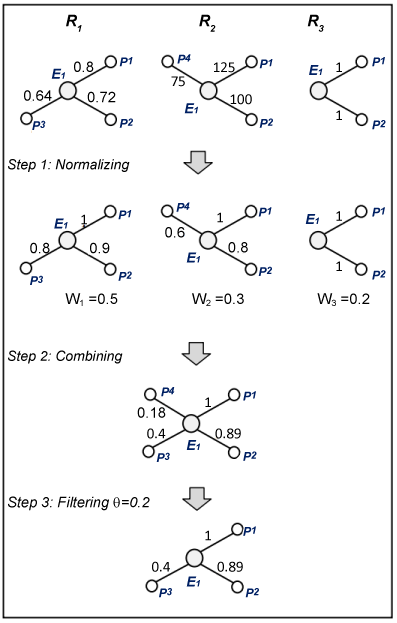
| Figure 2: Ensemble scheme for MeGaFiller. A big circle denotes an EC number, while a small circle presents a candidate gene. Scores of predictions made by each predictor were normalized. Then, the predictions were combined by the weight wi of each predictor. Finally, MeGaFiller applied a threshold θ to filter the final prediction list. |