 |
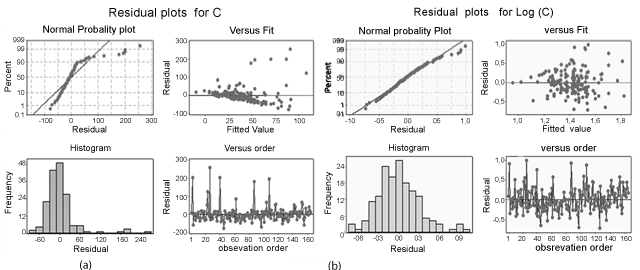
| Figure 1: Residual plots of (a) radon concentration and (b) logarithm of radon concentration. All measurements are shown. Each plot contains (I) percentage of residuals versus residual, (II) frequency distribution of the residuals, (III) residual versus fitted values according to C for (a) and log (C) for (b) and (IV) residual versus observation order. |