 |
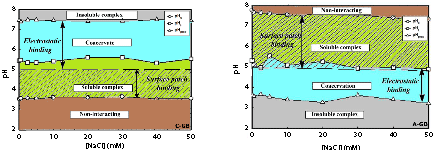
| Figure 12: Interaction phase diagram of a) C-GB system and b) Agar-GB system clearly defining various interaction regimes prevailing in the solution. Note the soluble complexes were formed initially through SPB binding and later through EB. Electrostatic interactions continued to dominate mesophase formation following coacervation transition. Solid lines are guide to the eye only. Reproduced with permission from Elsevier [95]. |