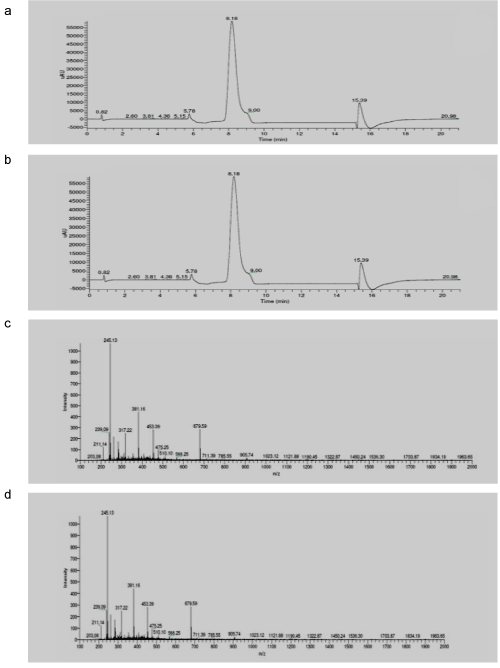
(b) Mass spectrum of Remazol black at 0th hour
(c) Chromatogram of 24 hour decolourised culture of Remazol black
(d) Mass spectrum of 24 hour decolourised culture of Remazol Black e) Pathway of degradation
 |
| Figure 12: (a) Chromatogram of Remazol black at 0th hour (b) Mass spectrum of Remazol black at 0th hour (c) Chromatogram of 24 hour decolourised culture of Remazol black (d) Mass spectrum of 24 hour decolourised culture of Remazol Black e) Pathway of degradation |