 |
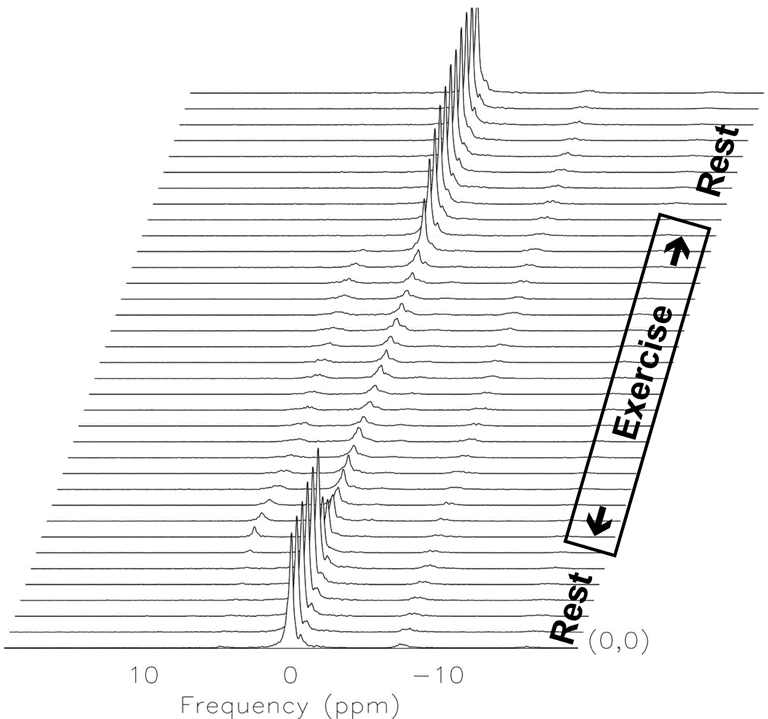
| Figure 3: Sample phosphorus spectra obtained from the calf muscle of a healthy subject prior, during, and following voluntary plantar flexion at 25% maximal voluntary contraction (MVC). Notice the changes in the phosphocreatine (PCr at 0 ppm) and the inorganic phosphate (Pi at 5 ppm) peaks as a result of the exercise. |