 |
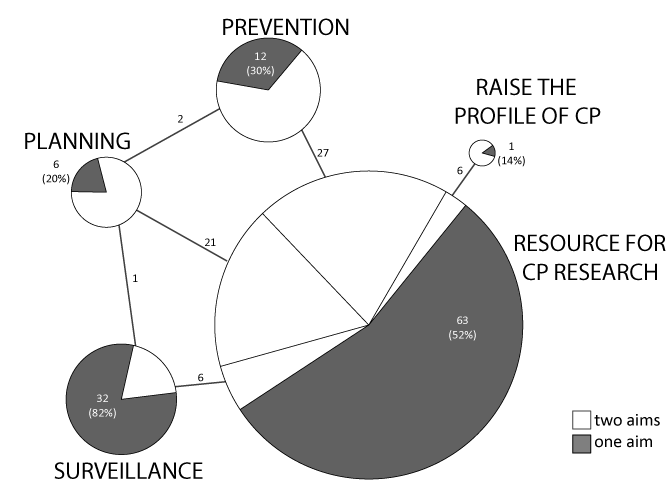
| Figure 3: CP Registry aims addressed. This figure summarizes how the 177 articles were categorized according to aim. The size of the pie chart representing each of the 5 aims is scaled to the number of articles in that aim. Within each aim, the pie chart is split between articles that addressed only one aim (dark gray, with number of articles assigned and percent of that aim) and those that addressed 2 (white, number of articles shown on connecting lines). When article(s) addressed two aims, it is shown by a line connecting the pie chart of each aim. For example, 6 articles were classified as addressing both surveillance and resource for CP research. |