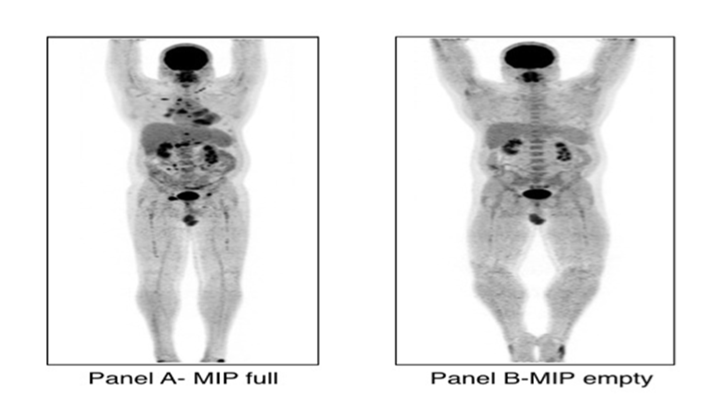
 FDG-PET/CT MIP (Maximum Intensity Projection) images of the same patient
during initial treatment (panel A) and after changing treatment (panel B). Panel
A shows intensely hypermetabolic sarcoid disease in the heart, bones and
lymph nodes while the patient was on treatment with steroids. Panel B shows
complete response to new treatment