 |
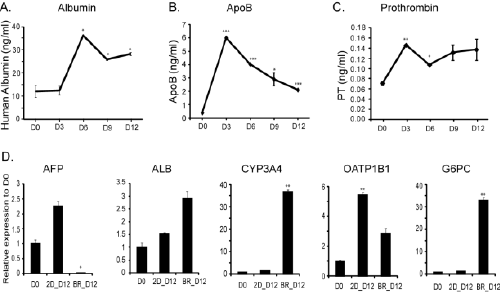
| Figure 6: Functional assessment of iHeps cultured in the hollow fiber bioreactor cartridge with continuous flow. (A, B, C) Plasma proteins albumin, apolipoprotein B, and prothrombin secretion by iHeps at indicated time points are shown. The mean values with standard deviations are presented in the graphs. (D) Relative gene expression to input day 0 iPSC-hepatocytes was calculated and values are shown in the graphs with standard deviations. Note the significant reduction of AFP level in cells cultured on a continuous flow condition. 2D: two-dimensional culturing in dish; BR: bioreactor culturing. Three independent experiments were performed and representative data is shown. |