 |
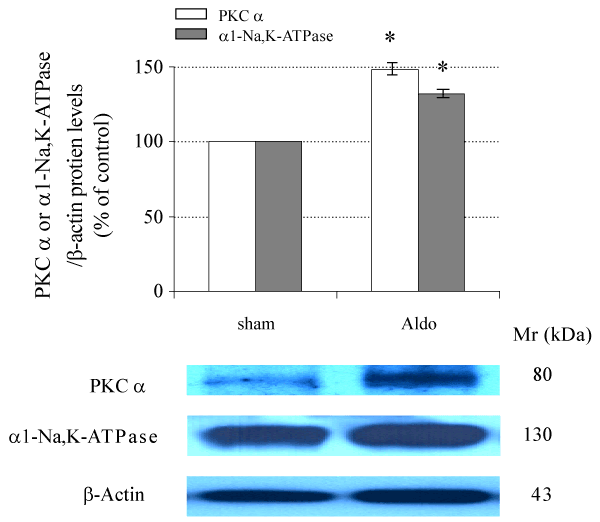
| Figure 1: Western blot analysis of renal PKC α and α1-Na,K-ATPase protein abundances in sham and Aldo groups. Histogram bars show the densitometric analyses ratios of PKC α or α1-Na,K-ATPase to β–actin intensity, and the representative immunoblot photographs are presented. Data are means ± SD of 8 independent experiments. *P<05 compared with the sham group. |