 |
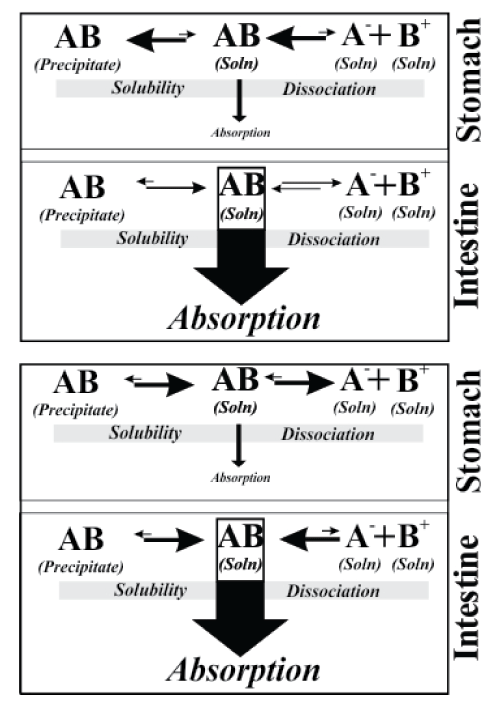
| Figure 7: Schematic representation of the drug absorption process of weakly acidic (above) and basic (below) drugs in the GI tract based on their ionization/ dissociation characteristics and the available surface areas (represented by downwards arrows). |