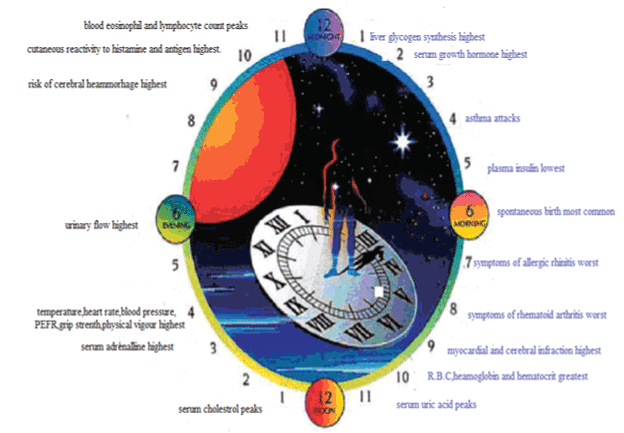
Figure 1:
Display in the form of a 24 h clock diagram of the approximate time, in human following the diurnal activity/nocturnal sleep routine, when symptoms or events of diseases are worst or most frequent [4].