|
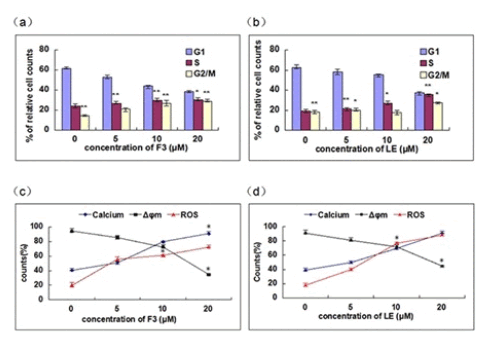
| Figure 2: a, b) Effects of F3 and LE on cell cycle distribution of MCF - 7 cells. c, d) Flow cytometric analysis of F3 and LE induced loss of mitochondrial membrane potential (Δφm), generation of reactive oxygen species (ROS), and an increase in intracellular Ca2+ levels. Each experiment was performed in triplicate. *p < 0.05, **p < 0.01 vs. control (0 μM). |