 |
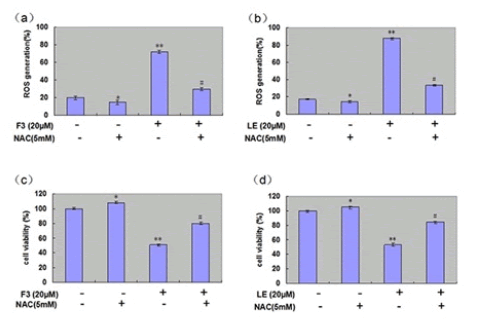
| Figure 3: Effects of antioxidant pretreatment on F3-mediated and LE-mediated ROS generation in MCF - 7 cells. Cells were either untreated or treated with F3 or LE (20 μM) in the absence or presence of N-acetylcysteine (NAC; 5 mM) for 48 h. a, b) Production of reactive oxygen species (ROS) was measured by flow cytometry. b) The data represent the percentages of cells within the specified fluorescence intensity range, determined using WinMDI 2.8 software. c, d) Cell viability examined using the MTT assay. *p < 0.05 and **p < 0.01 vs. control (0 μM), # p < 0.05 vs. F3-treated and LE-treated cells (20 μM). |