|
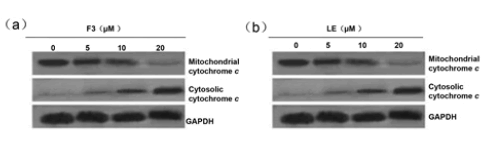
| Figure 6: F3 and LE induced release of cytochrome c. Total protein was extracted and cytosolic cytochrome c,mitochondrial cytochrome c were analyzed by Western blot. Protein levels were normalized to GAPDH. Data are presented as the means ± SDs of three independent experiments. *p < 0.05 vs. control (0 μM). |