 |
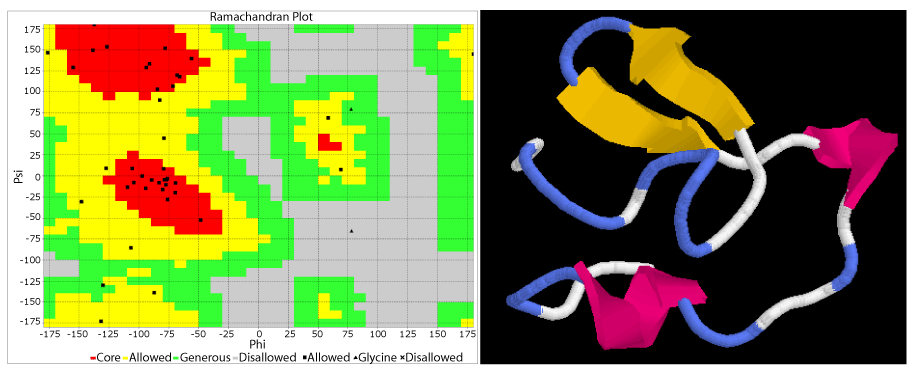
| Figure 1: (A) Predicted 3-D structure of ITX-1 Ramachandran plot analysis. The Plot statistics are: residues in most favoured regions 32 (78.0%); residues in additional allowed regions 8 (19.5%); residues in generously allowed 1 (2.4%). (B) Predicted 3-D structure of ITX-1 of Tegenaria agrestis show helix (pink color), beta strands (yellow) turns (blue) and white coil regions. |