 |
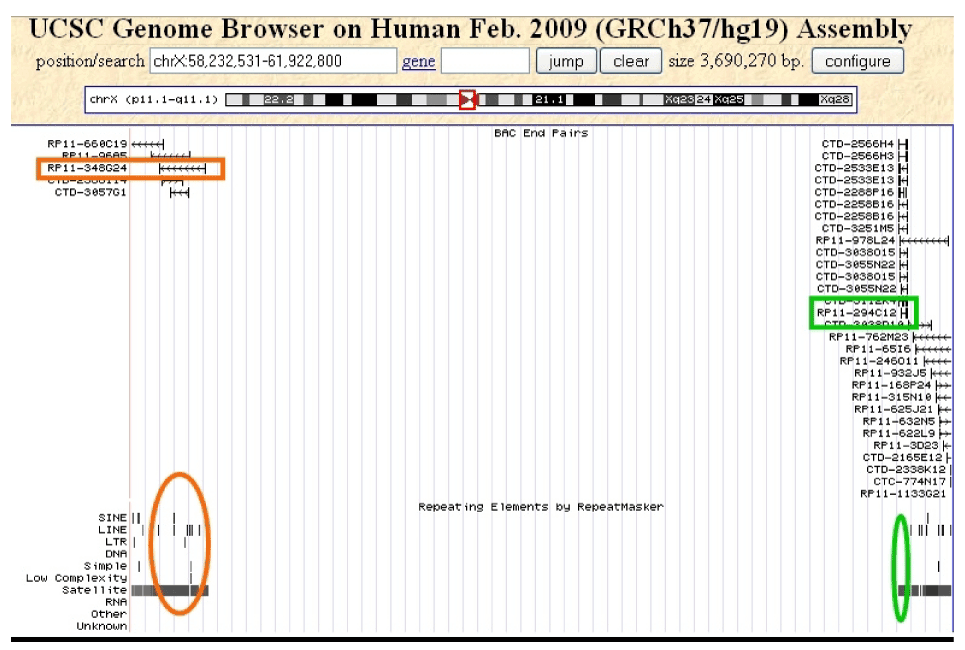
| Figure 3: Selection of an X chromosome-specific BAC clone using the UCSC Genome Browser. On top, the figure depicts a X chromosome ideogram with the selected pericentromeric region 58,232,531-61,922,800 bp highlighted by a red square. The lower part of the picture shows BAC end alignments within this interval as well as the locations of DNA repeat sequences (bottom). Clones and DNA repeat sequences of interest are indicated by colored squares and circles, respectively. Please note the extensive area of central, unchartered DNA representing the centromere. |