 |
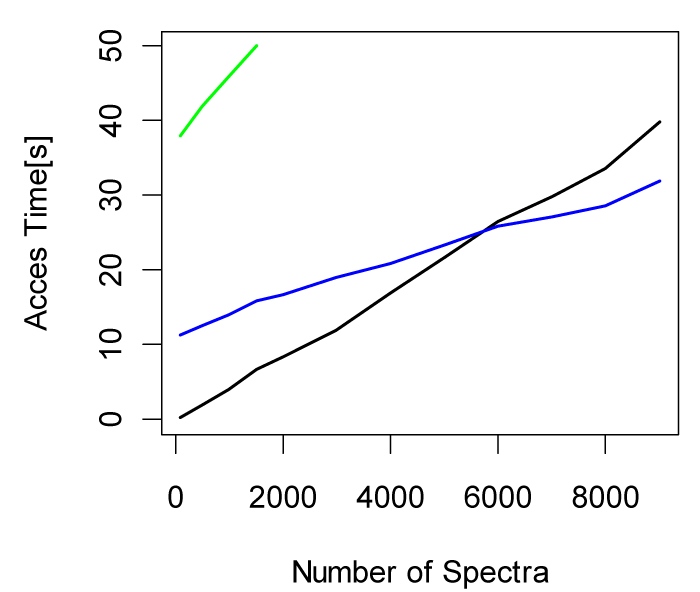
| Figure 3: Spectra retrieval times under different access methods for increasing set of requested mass spectra. The data sets for this figure were from high mass resolution instruments, LTQ-Orbitrap. The green line shows results from readmzXML tool of TPP. The program accepts only about 1800 scans as argument. Therefore, we were not able to extend the curve to larger number of spectra. As the number of spectra are increase the sequential access mode (blue line) becomes more efficient than random access mode (black line). |