 |
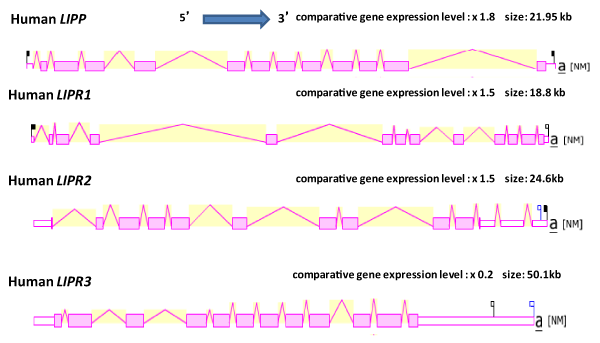
| Figure 5: Gene Structures and Major Splicing Variant for Human LIPP, LIPR1, LIPR2 and LIPR3 Gene Transcripts. Derived from AceView [12]; mature isoform variants (a) are shown with capped 5’- and 3’- ends for the predicted mRNA sequences; NM refers to the NCBI reference sequence; exons are in shaded pink; untranslated 5’- and 3’ sequences are in open pink; introns are represented as pink lines joining exons; the directions for transcription are shown as 5’ 3’; sizes of mRNA sequences are shown in kilobases (kb); comparative gene expression levels with the average human gene are shown. |