 |
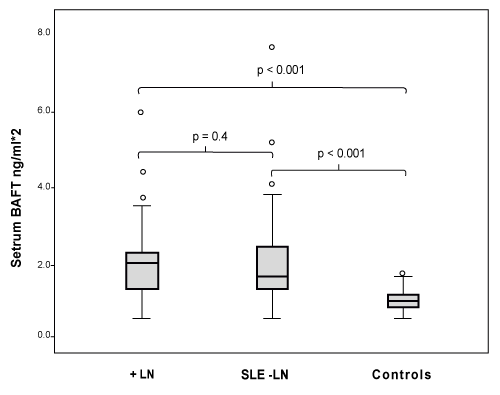
| Figure 1: Serum BAFF levels in SLE patients with (+LN) or without lupus nephritis (-LN) compared with healthy controls. The results are shown in box plots. The line inside the boxes indicates the medians; the outer borders of the boxes indicate the 25th and 75th percentiles; and the bars extending from the boxes indicate the 10th and 90th percentiles. |